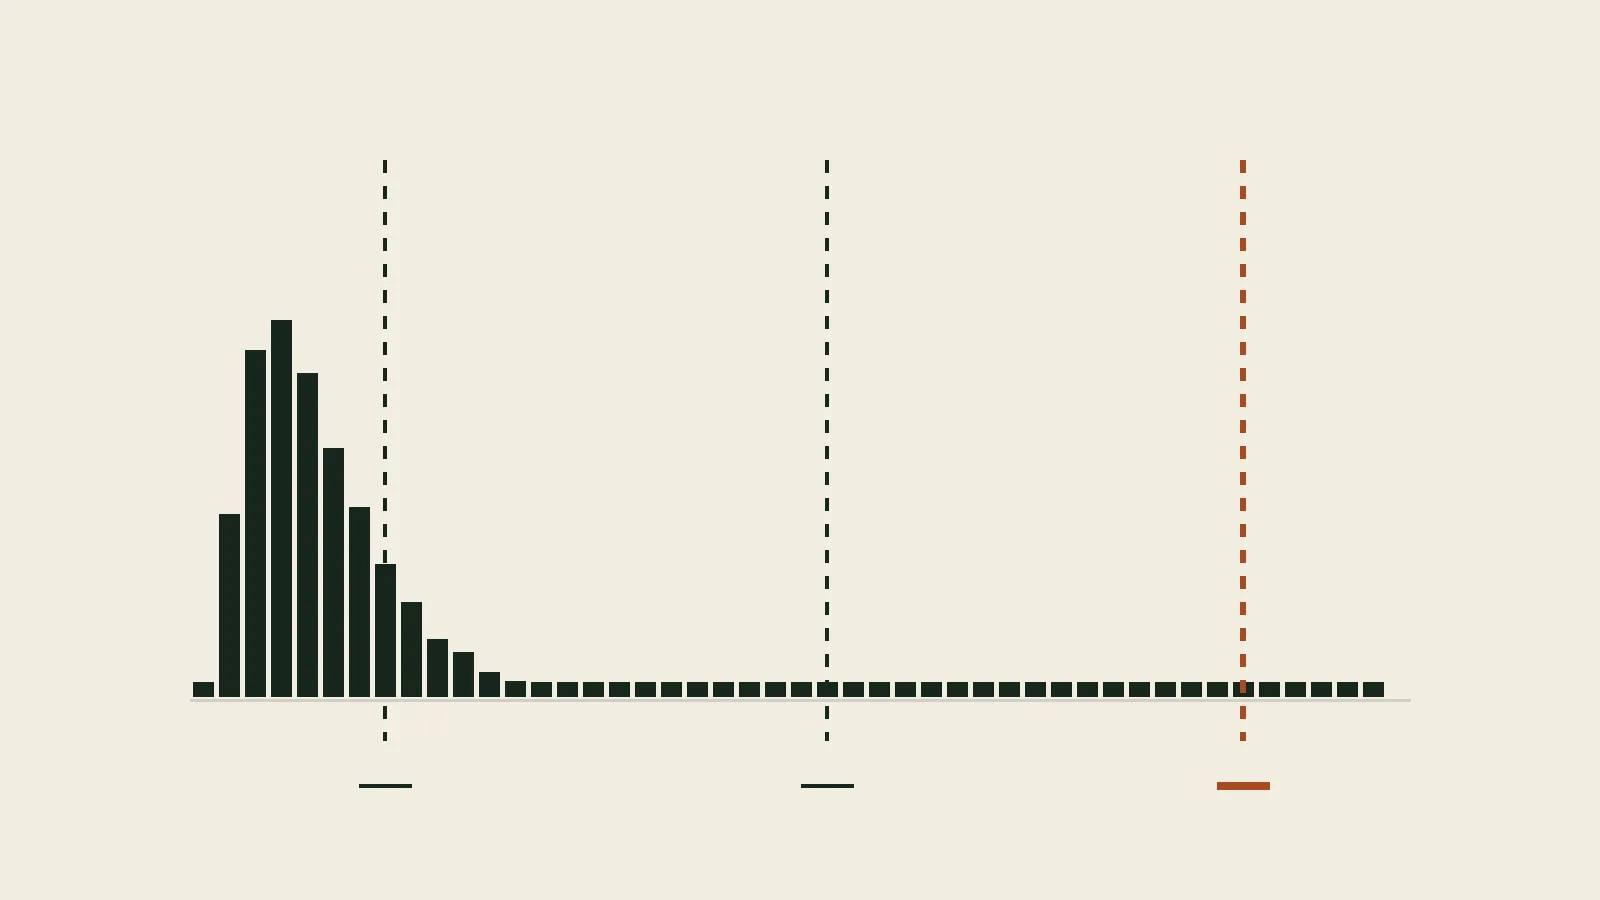
Every slow assistant I have been asked to look at had a cache before it had a measurement. Usually a semantic cache, sitting in front of the whole pipeline, added in a week when someone senior said the product felt sluggish. It helps the demo. It does very little for the tail, because the tail was never about repeated questions.
The order that works is unglamorous: measure each stage, write a budget, find the stage that breaks it, and only then decide whether a cache is the right instrument.
Averages hide the thing you will be paged for
A mean latency of a second can mean everyone waits a second, or that most people wait four hundred milliseconds and one in twenty waits six seconds. Those are different products. The second one generates support tickets and the first one does not.
Record the distribution from day one, and report three numbers together:
- p50 — what the product feels like.
- p95 — what your noisiest users experience, all day.
- p99 — what happens under the conditions that produce incidents.
Report them per stage, not just end to end. An end-to-end p99 tells you that something is slow; a per-stage p99 tells you which one, and you will not guess correctly. Reranking and generation are usually suspected; connection setup, embedding cold paths and a synchronous log write are usually guilty.
Write the budget as an allocation, not a wish. A total of 2.5 seconds at p95 split as embed 150ms, retrieve 250ms, rerank 400ms, generate 1,500ms, overhead 200ms is a sentence you can hold a pipeline to. “The assistant should feel fast” is not.
Give every stage a number
Instrument first, and make the instrumentation something the pipeline cannot be written without. Here the budget is a parameter of the pipeline, every stage is timed, and a stage that exceeds its allocation cancels rather than dragging the whole request past its deadline.
export type StageName = "embed" | "retrieve" | "rerank" | "generate";

export type Budget = Record<StageName, number>;

export interface StageTiming {
  stage: StageName;
  ms: number;
  timedOut: boolean;
}

export interface Traced<T> {
  value: T;
  timings: StageTiming[];
}

/** Runs one stage under its own deadline and records what it cost. */
export async function stage<T>(
  name: StageName,
  budget: Budget,
  timings: StageTiming[],
  run: (signal: AbortSignal) => Promise<T>,
): Promise<T> {
  const controller = new AbortController();
  const limit = budget[name];
  const timer = setTimeout(() => controller.abort(), limit);
  const started = performance.now();

  try {
    return await run(controller.signal);
  } finally {
    const ms = performance.now() - started;
    clearTimeout(timer);
    timings.push({ stage: name, ms, timedOut: controller.signal.aborted });
  }
}

export async function answer(
  question: string,
  budget: Budget,
  deps: {
    embed: (q: string, signal: AbortSignal) => Promise<Float32Array>;
    search: (v: Float32Array, signal: AbortSignal) => Promise<string[]>;
    rerank: (q: string, ids: string[], signal: AbortSignal) => Promise<string[]>;
    generate: (q: string, ids: string[], signal: AbortSignal) => Promise<string>;
  },
): Promise<Traced<string>> {
  const timings: StageTiming[] = [];

  const vector = await stage("embed", budget, timings, (s) => deps.embed(question, s));
  const candidates = await stage("retrieve", budget, timings, (s) => deps.search(vector, s));

  // Reranking is the first thing to drop: worse ordering beats no answer.
  let ranked = candidates;
  try {
    ranked = await stage("rerank", budget, timings, (s) => deps.rerank(question, candidates, s));
  } catch {
    ranked = candidates.slice(0, 5);
  }

  const text = await stage("generate", budget, timings, (s) => deps.generate(question, ranked, s));

  return { value: text, timings };
}
Two decisions are encoded there, and both are worth making explicitly rather than by accident. Each stage owns a deadline, so one slow dependency cannot consume the whole request. And reranking is optional — when it blows its budget the request continues with a worse ordering, because a slightly worse answer in time beats a better answer after the user has left.
Count the tokens where they are spent
Latency and cost come from the same place, so measure them in the same span. A per-stage record that carries tokens alongside milliseconds answers both the “why is it slow” and the “why is the bill like that” question from one table.
from __future__ import annotations

import time
from contextlib import contextmanager
from dataclasses import dataclass, field
from typing import Iterator


@dataclass(slots=True)
class Span:
    stage: str
    ms: float = 0.0
    input_tokens: int = 0
    output_tokens: int = 0
    cache_hit: bool = False

    def cost(self, input_per_million: float, output_per_million: float) -> float:
        return (
            self.input_tokens * input_per_million
            + self.output_tokens * output_per_million
        ) / 1_000_000


@dataclass(slots=True)
class Trace:
    request_id: str
    spans: list[Span] = field(default_factory=list)

    @contextmanager
    def record(self, stage: str) -> Iterator[Span]:
        span = Span(stage=stage)
        started = time.perf_counter()
        try:
            yield span
        finally:
            span.ms = (time.perf_counter() - started) * 1000
            self.spans.append(span)

    def total_ms(self) -> float:
        return sum(span.ms for span in self.spans)

    def as_row(self) -> dict[str, float | str | bool]:
        """One flat row per request — the unit your dashboard aggregates."""
        row: dict[str, float | str | bool] = {"request_id": self.request_id}
        for span in self.spans:
            row[f"{span.stage}_ms"] = round(span.ms, 1)
            row[f"{span.stage}_in"] = span.input_tokens
            row[f"{span.stage}_out"] = span.output_tokens
        row["total_ms"] = round(self.total_ms(), 1)
        return row
One row per request, one column per stage. Write it to whatever you already query — a table, a log sink, a warehouse. The value is not in the tooling; it is in being able to answer “which stage moved?” with a query instead of a theory.
Now decide what to cache
With that table in front of you, the cache question stops being a matter of taste. Three patterns show up, and they call for different caches:
Repeated questions, verbatim or near. A cache keyed on the normalised question helps, and its hit rate is measurable before you build it: group last month’s queries and count the repeats. If the number is small, a semantic cache is theatre — build it anyway and it will add a similarity lookup to every request in exchange for almost nothing.
Repeated retrieval for varied questions. Different phrasings converging on the same chunks. Cache the retrieval, keyed by the embedding neighbourhood or the normalised query, not the final answer. It cuts the retrieve-and-rerank stages while leaving generation free to phrase an answer for the question actually asked.
Repeated embedding of the same text. Cheap to fix and usually free: hash the input, keep the vector. This one is nearly always worth it and nearly never the reason anyone thinks they need a cache.
import hashlib
import re
import unicodedata


def cache_key(question: str, *, corpus_version: str) -> str:
    """Normalise before hashing, and version the key with the corpus.

    Without the corpus version, a re-index leaves the cache confidently
    serving answers from documents that no longer exist.
    """
    text = unicodedata.normalize("NFKC", question).casefold().strip()
    text = re.sub(r"\s+", " ", text)
    text = re.sub(r"[^\w\s]", "", text)

    return hashlib.sha256(f"{corpus_version}:{text}".encode()).hexdigest()
The corpus version in the key is the line people skip and regret. A cache that outlives the index it was built from is not a performance optimisation; it is a correctness bug with good latency.
The timeout ladder
Give every external call a deadline, and make the deadlines add up to less than the request’s own. Then decide, once, what happens at each rung:
- Embedding times out → fail the request. There is nothing to search with.
- Vector search times out → fall back to keyword search if you have one, otherwise fail. What that fallback is allowed to claim is a design decision of its own.
- Rerank times out → continue with the original ordering.
- Generation times out → stream what you have, or return the retrieved passages with a note that the summary did not finish.
Written down, that ladder is a design document for degradation. Not written
down, it is four try blocks that each do something different, added by four
people, on four bad days.
What goes on the dashboard
Five lines, and you can stop looking at the rest:
- p50, p95 and p99 end to end, per day;
- the same three for the slowest stage;
- timeout rate per stage;
- cache hit rate, next to the latency of a miss;
- cost per answered question.
If the last one is not on the list, the first four will eventually be optimised by spending money, and nobody will notice until the invoice arrives.